Qt for Python (and plotting with Matplotlib)
To able to develop GUI-based Python programs using Qt you need to install Qt and PySide2 (Python mapping for Qt 5, see Qt for Python). A good place to start is the Qt for Python getting started document.
Install the software
I have Python 3.8 on my Mac. I have also installed numpy and matplotlib with pip (since I have many different Python installations on my Mac, including 2.7, 3.7 and 3.8, I will use pip3.8 to be sure the right Python installation is used):
pip3.8 install numpy matplotlib
For my use, the open source license of Qt is OK. I installed Qt 5.12 from source code on my Mac with macOS 10.15 following these steps (described in Building Qt 5 from Git):
  cd path/to/my/git/clone/of/qt
  git clone git://code.qt.io/qt/qt5.git
  cd gt5
  git checkout 5.12
  perl init-repository
  cd ..
  mkdir qt5-build
  cd qt5-build
  ../qt5/configure -developer-build -opensource -nomake examples -nomake tests
  make -j4
In the configure step above, you have to accept the license of the software.
It is also possible to download the source code directly, without using git, at http://download.qt.io/official_releases/qt/. In the following example, I installed Qt 5.13.2 on my Mac. First, I downloaded the qt-opensource-mac-x64-5.13.2.dmg file from the URL above. Then I used the application qt-opensource-mac-x64-5.13.2.app to install the tools and the source code in my home directory in the folder Qt5.13.2. Finally, I performed the following steps (again, you have to accept to license in the configure step):
  cd ~/Qt5.13.2/5.13.2/Src/
  ./configure -prefix $PWD/qtbase -opensource -nomake tests
  make -j 4
The next step is to install PySide2 using pip:
pip3.8 install PySide2
Python Qt examples
Once all is installed, you can create your own first Qt application:
  import sys
  from PySide2.QtWidgets import QApplication, QLabel

  app = QApplication(sys.argv)
  label = QLabel("Hello World!")
  label.show()
  app.exec_()
Another example with two pop-up windows with buttons:
  import sys
  from PySide2.QtWidgets import QApplication, QPushButton

  def say_hello():
      print("Button clicked, Hello!")

  app = QApplication(sys.argv)

  button1 = QPushButton("Click me")
  button1.clicked.connect(say_hello)
  button1.show()

  button2 = QPushButton("Exit")
  button2.clicked.connect(app.exit)
  button2.show()

  app.exec_()
A larger example with a random multiple language Hello World text:
  import sys
  import random
  from PySide2 import QtCore, QtWidgets

  class MyWidget(QtWidgets.QWidget):

      msgformat = "%s"
      hello = ["Hallo Welt", "你好,世界",
          "Hei maailma", "Hola Mundo", "Привет мир"]

      def __init__(self):
          QtWidgets.QWidget.__init__(self)
          self.button = QtWidgets.QPushButton("Click me!")
          self.text = QtWidgets.QLabel(
              self.msgformat % ("Hello World",))
          self.text.setAlignment(QtCore.Qt.AlignCenter)
          self.layout = QtWidgets.QVBoxLayout()
          self.layout.addWidget(self.text)
          self.layout.addWidget(self.button)
          self.setLayout(self.layout)

          self.button.clicked.connect(self.magic)

      def magic(self):
          self.text.setText(
              self.msgformat % (random.choice(self.hello),))

  app = QtWidgets.QApplication(sys.argv)
  widget = MyWidget()
  widget.show()
  sys.exit(app.exec_())
How to use Matplotlib in a Python Qt application
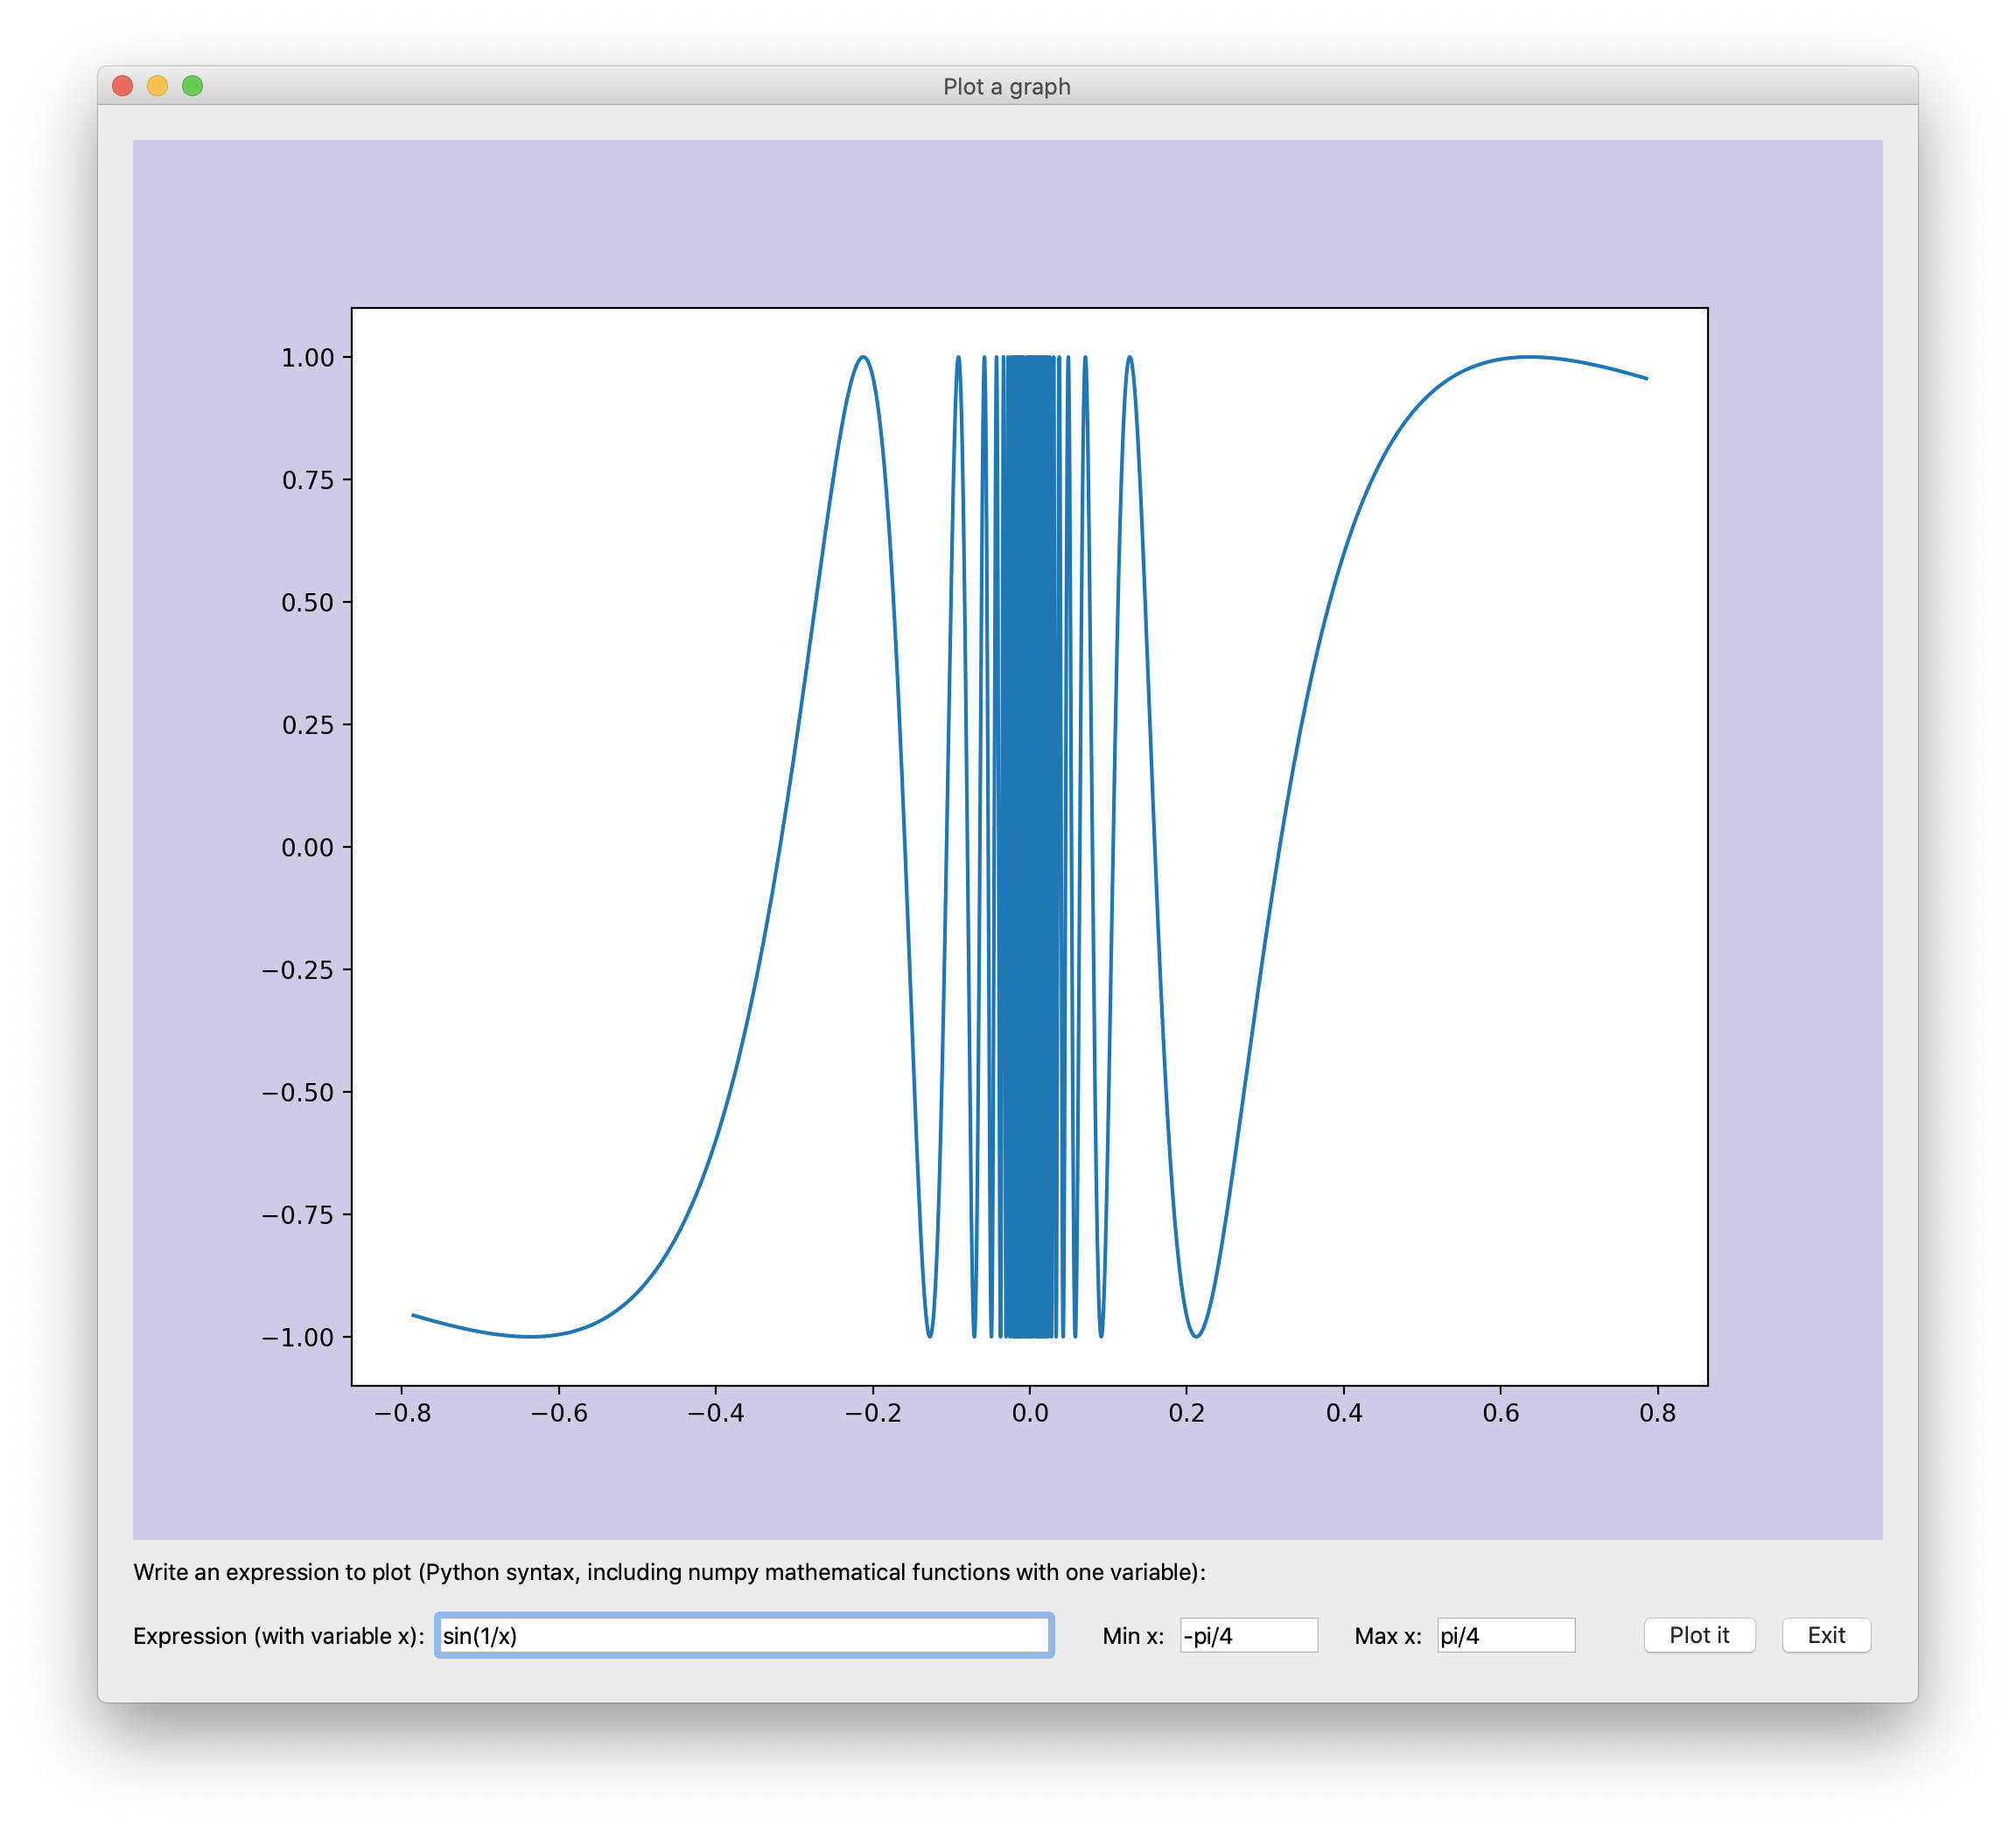
This has been fun, but no plotting of graphs so far. How can we connect Matplotlib with Qt? We start with this code:
  # Qt and matplotlib integration
  import matplotlib
  matplotlib.use("Qt5Agg")
  from matplotlib.backends.backend_qt5agg import FigureCanvas
  from matplotlib.figure import Figure
We use matplotlib.use("Qt5Agg") to select the Qt backend for rendering and GUI integration. FigureCanvas is the area onto which the figure is drawn. Since we are creating a Qt application where we want to plot a graph in the GUI, we have to use the FigurCanvas from Qt. A Matplotlib Figure includes the plot elements. We will in this example add a plot to such a Figure (see add_subplot below).
We will use different Qt widgets in the implementation of this example. QLabel and QLineEdit for text, QPushButton for buttons, and QHBoxLayout and QVBoxLayout to create the layout of the application:
  # Use Qt with the PySide2 mapping (Qt's official Python mapping)
  from PySide2.QtWidgets import QApplication, QWidget
  from PySide2.QtWidgets import QHBoxLayout, QVBoxLayout
  from PySide2.QtWidgets import QPushButton, QLabel, QLineEdit
We will create a widget, MyPlotWidget, for our plotting application. It includes a canvas for the plot:
  class MyPlotWidget(QWidget):

      labeltext = "Write an expression to plot (Python " + \
          "syntax, including numpy mathematical functions "
          "with one variable): "

      def __init__(self, app):
          QWidget.__init__(self)
          self.fig = Figure(
              figsize=(10,8), dpi=100,
              facecolor=(0.8,0.8,0.9), edgecolor=(0,0,0))
          self.ax = self.fig.add_subplot(1, 1, 1)
          self.canvas = FigureCanvas(self.fig)
Then we create all the building blocks for the application, including input text (QLineEdit), buttons (QPushButton) and help text (QLabel):
          # Create the building blocks
          self.setWindowTitle("Plot a graph")
          self.plotlabel = QLabel(self.labeltext)
          self.exprlabel = QLabel("Expression (with variable x):")
          self.expr = QLineEdit("sin(1/x)")
          self.minlabel = QLabel("Min x:")
          self.min = QLineEdit("-pi/4")
          self.min.setFixedWidth(80)
          self.maxlabel = QLabel("Max x:")
          self.max = QLineEdit("pi/4")
          self.max.setFixedWidth(80)
          self.button1 = QPushButton("Plot it")
          self.button2 = QPushButton("Exit")
The overall application layout is specified by at QVBoxLayout, a vertical stack of building blocks (widgets). Inside this box we also have a horizontal line of building blocks created with a QHBoxLayout:
          # Define layout
          self.minmaxline = QHBoxLayout()
          self.layout = QVBoxLayout()
          self.layout.addWidget(self.canvas)
          self.layout.addWidget(self.plotlabel)
          self.minmaxline.addWidget(self.exprlabel)
          self.minmaxline.addWidget(self.expr)
          self.minmaxline.addSpacing(20)
          self.minmaxline.addWidget(self.minlabel)
          self.minmaxline.addWidget(self.min)
          self.minmaxline.addSpacing(10)
          self.minmaxline.addWidget(self.maxlabel)
          self.minmaxline.addWidget(self.max)
          self.minmaxline.addSpacing(30)
          self.minmaxline.addWidget(self.button1)
          self.minmaxline.addWidget(self.button2)
          self.layout.addLayout(self.minmaxline)
          self.setLayout(self.layout)
The final thing we do when a MyPlotWidget is initialised is to connect the GUI-actions to the code (button clicks, and carriage return in the edit fields):
          # Connect button clicks and CR to actions
          self.button1.clicked.connect(self.plotit)
          self.button2.clicked.connect(app.exit)
          self.expr.returnPressed.connect(self.plotit)
          self.min.returnPressed.connect(self.plotit)
          self.max.returnPressed.connect(self.plotit)
The method plotit calculates 100.001 points on the graph for the given x-values and the expression (function). It then clears the plot and updates it with the calculated values. Finally the updated plot is drawn in the canvas:
      def plotit(self):
          x = linspace(
              eval(self.min.text()),
              eval(self.max.text()), 100001)
          y = eval(self.expr.text())
          self.plotlabel.setText(self.label-text)
          self.ax.clear()
          self.ax.plot(x, y)
          self.ax.figure.canvas.draw()
          self.ax.figure.canvas.blit(self.ax.figure.bbox)
That was the complete implementation of the MyPlotWidget class. The last lines of code create a Qt application with such a visible widget before the execution is handed over to the Qt execution environment:
  # Create Qt app and widget
  app = QApplication(sys.argv)
  widget = MyPlotWidget(app)
  widget.show()
  sys.exit(app.exec_())
The complete code for this Qt and Matplotlib example is available here: qt-matplotlib.py (pretty print HTML version).

Update (May 26 2020)
To install Qt on macOS, I currently use Homebrew instead of manually downloading, compiling and installing it as described above:
brew install qt
Update (December 13 2021)
An update on Qt and Python can be found in this new post: Qt for Python (on Mac). The examples from this post is also available updated for Qt 6: qt-matplotlib.